
Some reports from Q2 2011.
Highlights from the report:
Vendors shipped 365.4 million units in 2Q11 compared to 328.4 million units in the second quarter of 2010. The feature phone market shrank 4% in 2Q11 when compared to 2Q10. The decline in shipments was most prominent in economically mature regions, such as the United States, Japan, and Western Europe, as users rapidly transition to smartphones. “Stalwarts such as Nokia are losing share in the feature phone category to low-cost suppliers such as Micromax, TCL-Alcatel, and Huawei.”
Top Five Mobile Phone Vendors, Shipments, and Market Share, Q2 2011 (Units in Millions)
| Vendor | 2Q11 Unit Shipments | 2Q11 Market Share | 2Q10 Unit Shipments | 2Q10 Market Share | Year-Over-Year Change | |||||
| Nokia | 88.5 | 24.2% | 111.1 | 33.8% | -20.3% | |||||
| Samsung | 70.2 | 19.2% | 63.8 | 19.4% | 10.0% | |||||
| LG Electronics | 24.8 | 6.8% | 30.6 | 9.3% | -18.9% | |||||
| Apple | 20.3 | 5.6% | 8.4 | 2.6% | 141.8% | |||||
| ZTE | 16.6 | 4.5% | 12.2 | 3.7% | 36.0% | |||||
| Others | 145 | 39.7% | 102.3 | 31.2% | 41.7% | |||||
| Total | 365.4 | 100.0% | 328.4 | 100.0% | 11.3% | |||||
- Strategy Analytics: Apple Becomes World’s Number One Smartphone Vendor in Q2 2011
Highlights: According to the latest research from Strategy Analytics, global smartphone shipments grew an impressive 76 percent annually to reach a record 110 million units in the second quarter of 2011. Both Apple and Samsung overtook long-time volume leader Nokia for the top two spots in our rankings.
| Exhibit 1: Global Smartphone Vendor Shipments and Market Share in Q2 2011 | ||||
| Global Smartphone Vendor Shipments (Millions of Units) | Q2 ’10 | Q2 ’11 | ||
| Apple | 8.4 | 20.3 | ||
| Samsung | 3.1 | 19.2 | ||
| Nokia | 23.8 | 16.7 | ||
| Others | 27.1 | 53.8 | ||
| Total | 62.4 | 110.0 | ||
| Global Smartphone Vendor Marketshare % | Q2 ’10 | Q2 ’11 | ||
| Apple | 13.5 | % | 18.5 | % |
| Samsung | 5.0 | % | 17.5 | % |
| Nokia | 38.1 | % | 15.2 | % |
| Others | 43.4 | % | 48.9 | % |
| Total | 100.0 | % | 100.0 | % |
| Growth Year-over-Year % | 50.4 | % | 76.3 | % |
Highlights: According to June data from Nielsen, Google’s Android operating system (OS) now claims the largest share of the U.S. consumer smartphone market with 39 percent. Apple’s iOS is in second place with 28 percent, while RIM Blackberry is down to 20 percent.

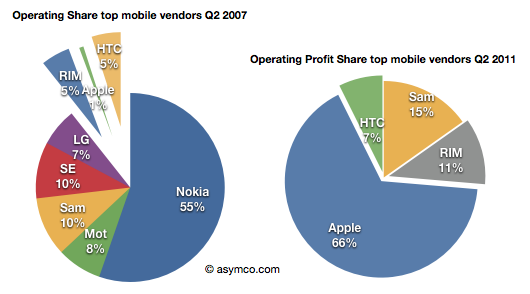
- Horace Dediu at Asymco.com Apple captured two thirds of available mobile phone profits in Q2
Highlights: The story remains largely unchanged from last quarter: Three companies which captured 11% of the profits before the modern smartphone era started (four years ago!) now capture 84% of the profits. Only one global brand phone vendor selling non-smart voice-oriented feature phones is still profitable however, as we shall see later, the only reason profits still exist for any vendor is due to the strength of their smartphone portfolio.
Highlights: ZTE Became Fifth-Largest Mobile Phone Manufacturer and RIM Dropped to No. 6to Gartner, Inc. (see Table 1). Sales of smartphones were up 74 percent year-on-year and accounted for 25 percent of overall sales in the second quarter of 2011, up from 17 percent in the second quarter of 2010.“Smartphone sales continued to rise at the expense of feature phones,” said Roberta Cozza, principal research analyst at Gartner.
Table 1
Worldwide Mobile Device Sales to End Users by Vendor in 2Q11 (Thousands of Units)
| Vendor | 2Q11
Units |
2Q11 Market Share (%) | 2Q10
Units |
2Q10 Market Share (%) |
| Nokia | 97,869.3 | 22.8 | 111,473.7 | 30.3 |
| Samsung | 69,827.6 | 16.3 | 65,328.2 | 17.8 |
| LG | 24,420.8 | 5.7 | 29,366.7 | 8.0 |
| Apple | 19,628.8 | 4.6 | 8,743.0 | 2.4 |
| ZTE | 13,070.2 | 3.0 | 6,730.6 | 1.8 |
| Research In Motion | 12,652.3 | 3.0 | 11,628.8 | 3.2 |
| HTC | 11,016.1 | 2.6 | 5,908.8 | 1.6 |
| Motorola | 10,221.4 | 2.4 | 9,109.4 | 2.5 |
| Huawei Device | 9,026.1 | 2.1 | 5,276.4 | 1.4 |
| Sony Ericsson | 7,266.5 | 1.7 | 11,008.5 | 3.0 |
| Others | 153,662.1 | 35.8 | 103,412.6 | 28.1 |
| Total | 428,661.2 | 100.0 | 367,986.7 | 100.0 |
Source: Gartner (August 2011)
Google and Apple are the obvious winners in the smartphone ecosystem. The combined share of iOS and Android in the smartphone operating system (OS) market doubled to nearly 62 percent in the second quarter of 2011, up from just over 31 percent in the corresponding period of 2010 (see Table 2). Gartner analysts observed that these two OSs have the usability that consumers enjoy, the apps that consumers feel they need, and increasingly a portfolio of services delivered by the platform owner as well.
Table 2
Worldwide Smartphone Sales to End Users by Operating System in 2Q11 (Thousands of Units)
| Operating System | 2Q11
Units |
2Q11 Market Share (%) | 2Q10
Units |
2Q10 Market Share (%) |
| Android | 46,775.9 | 43.4 | 10,652.7 | 17.2 |
| Symbian | 23,853.2 | 22.1 | 25,386.8 | 40.9 |
| iOS | 19,628.8 | 18.2 | 8,743.0 | 14.1 |
| Research In Motion | 12,652.3 | 11.7 | 11,628.8 | 18.7 |
| Bada | 2,055.8 | 1.9 | 577.0 | 0.9 |
| Microsoft | 1,723.8 | 1.6 | 3,058.8 | 4.9 |
| Others | 1,050.6 | 1.0 | 2,010.9 | 3.2 |
| Total | 107,740.4 | 100.0 | 62,058.1 | 100.0 |
Source: Gartner (August 2011)